
Candlestick formation
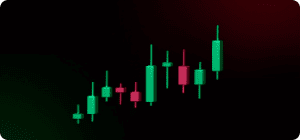
Formation of candlestick As we have mentioned in the intro to fundamentals, a candlestick formation is established by defining the opening, high, low and closing price of the specific time frame the candlestick refers to. If the opening price is above the closing price, then a candlestick with coloured body of prices is drawn. Usually, […]
Oscillators

In the last lesson, we discussed the Bollinger bands, in the current lesson we are to take a peak in oscillators. Oscillators are momentum indicators. In a sense, they measure the “speed” of the price action, how fast prices are going up or down. There are three situations when an oscillator is most useful: The […]
Bollinger Bands

In the last lesson we discussed moving averages in the current lesson we are to have a look at the Bollinger bands. The Bollinger Bands is a technique developed by John Bollinger and is based on Statistics, at which practically two bands are being placed around the 20 period moving average. The upper band would […]
Moving Averages

In the last lesson we discussed continuation patterns, in the current lesson we are to enter mechanical technical analysis and more particularly moving averages. The moving average is one of the most widely used technical indicators. It identifies if a new trend has begun or if an old trend has ended or reversed. It tracks […]