
ローソク足パターン
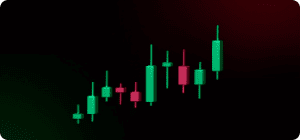
Formation of candlestick As we have mentioned in the intro to fundamentals, a candlestick formation is established by defining the opening, high, low and closing price of the specific time frame the candlestick refers to. If the opening price is above the closing price, then a candlestick with coloured body of prices is drawn. Usually, red colour is used for colouring the candle. If the closing price is above the opening price, then a hollow candlestick (normally displayed in white with black border or a full green colour) is drawn. The thick part of the candlestick is named the body or real body which can be long, normal or short […]
オシレーター

In the last lesson, we discussed the Bollinger bands, in the current lesson we are to take a peak in oscillators. Oscillators are momentum indicators. In a sense, they measure the “speed” of the price action, how fast prices are going up or down. There are three situations when an oscillator is most useful: The stochastic oscillator is a momentum indicator based on where prices close within their high-low range. It ranges between 0 and 100, and alerts traders for overbought or oversold conditions. Readings above 80 are considered overbought, and below 20 oversold. The crossovers between the filled line and the dashed line are used in a similar manner […]
ボリンジャーバンド

In the last lesson we discussed moving averages in the current lesson we are to have a look at the Bollinger bands. The Bollinger Bands is a technique developed by John Bollinger and is based on Statistics, at which practically two bands are being placed around the 20 period moving average. The upper band would be equal to the 20 period moving average, plus 2 standard deviations, while the lower band is equal to the 20 moving average minus 2 standard deviations. A standard deviation is a statistical concept that describes how prices are spread around an average value. Using two standard deviations ensures that 95% of the price data […]
移動平均

In the last lesson we discussed continuation patterns, in the current lesson we are to enter mechanical technical analysis and more particularly moving averages. The moving average is one of the most widely used technical indicators. It identifies if a new trend has begun or if an old trend has ended or reversed. It tracks the progress of a trend. Moving average It is the average for a certain body of data. For example, if a 10-period average of closing prices is desired, the closing prices for the last 10 periods are added up and the total is divided by 10. The body of data to be averaged moves forward […]